Sleep Trackers Explained: Read Your Data, Sleep Better
Written by: Matthew Timmins, Founder and Managing Director, Leva Sleep
Key takeaways about sleep trackers and Leva Sleep
- Consumer sleep trackers estimate sleep stages from peripheral sensors. Validation studies show only 70.9–76.3% agreement with clinical polysomnography for four-stage classification.
- Actigraphy, PPG, radar, and ballistocardiography each measure different signals with specific accuracy trade-offs. No consumer sensor directly records brain-wave activity.
- Total sleep time trends over multiple weeks are more reliable than single-night stage percentages, which carry mean absolute errors of 15–30 minutes.
- Over-reliance on nightly tracker data can trigger orthosomnia, a pattern where anxiety about sleep scores pushes users toward unnecessary medical treatment.
- Leva Sleep closes the gap between data and action by automatically adjusting head elevation in response to snoring and restless sleep signals. See how Leva Sleep turns sleep data into automatic adjustments.
How different sleep tracking sensors collect your data
Consumer sleep trackers rely on four main sensor categories. Each one measures a different physiological signal and carries its own accuracy trade-offs.
Actigraphy uses MEMS tri-axial accelerometers that typically sample motion at 25–100 Hz to classify epochs as sleep or wake based on sustained immobility. Classical algorithms including Cole-Kripke (1992) and Sadeh (1994) achieve high sensitivity for sleep, commonly above 90%. Specificity for wake is lower, which overestimates total sleep time when users lie still while awake. Actigraphy cannot distinguish sleep stages because movement data alone do not capture sleep architecture.
Photoplethysmography (PPG) shines green LED light into the skin to measure pulse beat by beat. Heart rate drops and stabilizes in deep non-REM sleep and becomes more variable in REM sleep. PPG-based algorithms use these patterns to infer stages. Red and infrared optical sensors also measure peripheral oxygen saturation (SpO2) to detect breathing disturbances, although intermittent sampling limits sensitivity.
Radar supports contactless monitoring. The iSleep S200G uses a 2.45 GHz micro-power radar placed 0.5–0.8 m from the chest to detect body movement and respiration. In a 2026 validation of 11 healthy adults, it achieved an intraclass correlation coefficient of 0.78 for total sleep time against PSG.
Ballistocardiography (BCG) detects micro-vibrations from heartbeats and breathing transmitted through a mattress or under-mattress pad. The contactless Sleep Dot B501 achieved an ICC of 0.89 for total sleep time and epoch-by-epoch sensitivity of 0.94 against PSG in the 2026 study. That performance is comparable to research-grade actigraphy.
| Sensor Type | Measured Signals | Reported Accuracy Range | Typical Placement |
|---|---|---|---|
| Radar | Body movement, respiration rate | ICC 0.78 for TST vs. PSG (2026, n=11) | Bedside unit, 0.5–0.8 m from chest |
| Ballistocardiography (BCG) | Heartbeat micro-vibrations, respiration | ICC 0.89 for TST, sensitivity 0.94 vs. PSG (2026, n=11) | Under-mattress pad or sensor strip |
| PPG (optical) | Heart rate, HRV, SpO2, respiration rate | Highest published stage kappa for any wrist device is 0.65 (wrist PPG+accelerometer, 2019) | Wrist or finger (ring) |
| Actigraphy (accelerometer) | Body movement, activity counts | Sadeh 2011 reports reasonable validity and reliability for assessing sleep-wake patterns in normal individuals with average or good sleep quality, without a specific agreement percentage versus PSG | Wrist, ankle, or clip-on |
Understanding these sensor differences helps you decide which tracking approach fits your comfort, lifestyle, and data needs. The key takeaways from the sensor comparison:
- No consumer sensor type directly measures brain-wave activity. All stage estimates are inferences from peripheral signals.
- Contactless devices remove compliance burden but lose the HRV signal quality available from finger-based PPG.
- Multi-sensor fusion that combines accelerometer and PPG now represents the minimum industry standard for consumer sleep stage estimation.
- PPG-based sensors show reduced accuracy on Fitzpatrick skin types IV–VI because higher melanin absorption reduces signal strength, which creates a population-level equity concern in validation literature.
Wearable versus contactless trackers and how to choose
Wearable devices such as wrist bands and smart rings maintain skin contact throughout the night and support continuous PPG and HRV capture. Smart rings provide higher correlation for overnight HRV measurement than wrist-worn PPG devices because finger-artery placement yields higher signal amplitude and lower motion artifact during sleep. The trade-off is compliance. Some users remove wearables because of discomfort, skin irritation, or charging conflicts, which creates data gaps that distort trend analysis.
Contactless devices such as under-mattress sensors and radar units remove the compliance problem but cannot capture wrist- or finger-based HRV. A 2025 validation study of an under-mattress sensor reported 83% overall sleep-wake accuracy, 95% sensitivity, and 37% specificity for wake detection. This pattern overestimates total sleep time and appears across sensor types. For couples, contactless devices add another benefit because each partner’s data is captured independently without requiring both to wear a device.
Neither category solves the core limitation. No consumer device as of mid-2026 has published peer-reviewed validation showing N3 stage accuracy comparable to polysomnography. The choice between wearable and contactless devices therefore depends more on comfort and compliance than on accuracy.
How to read the numbers from your sleep tracker
Total sleep time (TST) is usually the most reliable metric. Recent validation studies of consumer wearables versus portable PSG report mean absolute errors for TST in the range of 15–30 minutes. That margin is clinically meaningful for a single night. Over several weeks, however, the errors tend to average out, which makes multi-night TST trends a reasonable behavioral signal.
Sleep efficiency, the percentage of time in bed spent asleep, works as a reasonable proxy metric. It inherits the quiet-wakefulness misclassification problem noted earlier. Sleep efficiency therefore tends to overestimate sleep in individuals with insomnia who lie still while awake.
Sleep stages are the least reliable outputs. Mean absolute error in REM percentage estimation ranged from 8 to 14 percentage points across devices in the 2026 study. Deep sleep (N3) and REM estimates show the largest discrepancies versus PSG, which limits single-night stage readouts to directional signals at best.
Wake after sleep onset (WASO) is consistently underestimated. Consumer sleep trackers show variable bias versus PSG, with some devices underestimating WASO by 10–54 minutes and others overestimating it because PPG and accelerometer sensors cannot reliably distinguish quiet wakefulness from light sleep.
The practical takeaway is straightforward. Use TST and sleep timing trends across two or more weeks as behavioral feedback. Because stage estimates carry 8–14 percentage point errors even in validation studies, treat single-night stage percentages as approximate rather than precise.
Age-based deep sleep ranges you can expect
Deep sleep (N3 or slow-wave sleep) declines with age as a normal physiological process. The table below summarizes normative ranges from the Ohayon et al. (2004) meta-analysis of 65 PSG studies involving 3,577 subjects, supplemented by population averages reported by Cora Health.
| Age Band | Deep Sleep (N3) % of TST | REM Sleep % of TST |
|---|---|---|
| 18–29 years | 14–18% | 20–25% |
| 30–40 years | 15–23% | 20–25% |
| 41–55 years | 8–12% | 19–24% |
| 56–65 years | 5–9% | 18–23% |
| 65+ years | 1–8% | 17–22% |
Adults over 70 commonly exhibit N3 percentages of 1–5%, which reflects normal age-related physiology rather than a disorder, even when consumer wearables flag these values as unusually low. N3 decline with age can vary by sex and menopausal status.
Risks that come with over-focusing on sleep data
As noted earlier, orthosomnia, the anxiety about sleep scores mentioned in the key takeaways, is a documented consequence of consumer sleep tracking. The 2019 case series in the Journal of Clinical Sleep Medicine that identified this pattern described patients who developed anxiety about tracker data and sought medical treatment despite lacking clinically significant sleep disorders.
Additional risks include misreading age-normal stage distributions as pathological and over-correcting sleep behaviors based on single-night readouts. Users can also feel falsely reassured by high sleep-efficiency scores that mask fragmented sleep in individuals with insomnia. Over a 2–4 week period, consumer sleep trackers can reveal actionable directional patterns such as correlations between alcohol intake and fragmented sleep, even though they cannot support nightly stage-based behavioral adjustments. That distinction between trends and nightly precision is the right frame for interpreting consumer data.
Clinical limits of consumer trackers
The American Academy of Sleep Medicine states that consumer sleep trackers generally fall under the health and wellness category and lack FDA clearance as medical devices. They should not be used to diagnose sleep disorders. The AASM position statement specifies that consumer sleep devices lack validation against polysomnography, carry no FDA clearance to diagnose or treat sleep disorders, and should supplement rather than replace clinical evaluation.
Consumer sleep trackers are not validated or appropriate for medical diagnosis of conditions such as sleep apnea, periodic limb movement disorder, or narcolepsy, which require clinical polysomnography evaluation. Clinicians commonly recommend sleeping with the head elevated for conditions including sleep apnea, acid reflux, and post-surgical recovery. An adjustable base achieves that position at home, night after night, without stacked pillows. No consumer tracker, however accurate, can replace that mechanical support.
How Leva Sleep turns tracking data into real-time position changes
The main actionability gap in consumer sleep tracking comes from limited integration rather than accuracy alone. Even a tracker that correctly identifies snoring or restless sleep cannot reposition the sleeper. The data stays in an app while the body remains in the same geometry that produced the signal.
Integrated sleep systems close that gap by pairing sensor inputs with real-time mechanical response. Leva Sleep’s AI-powered micro-adjustment technology detects signals such as snoring and automatically adjusts the head elevation of the adjustable base to help open the airway. The sleeper does not need to wake, open an app, or change position manually. The system acts on the data rather than only reporting it.
For couples, this integration matters most on a split adjustable base. Each partner’s side responds independently, so one partner’s positional adjustment does not disturb the other. Leva Sleep offers the largest selection of Split Queen adjustable beds in North America, with five distinct packages from $1,399, 30" × 80" mattresses manufactured in-house, and a full line of Split Queen bedding and accessories. For couples whose bedroom cannot accommodate a Split King’s 76-inch footprint, the Split Queen’s 60-inch width preserves independent adjustability without requiring a larger room.
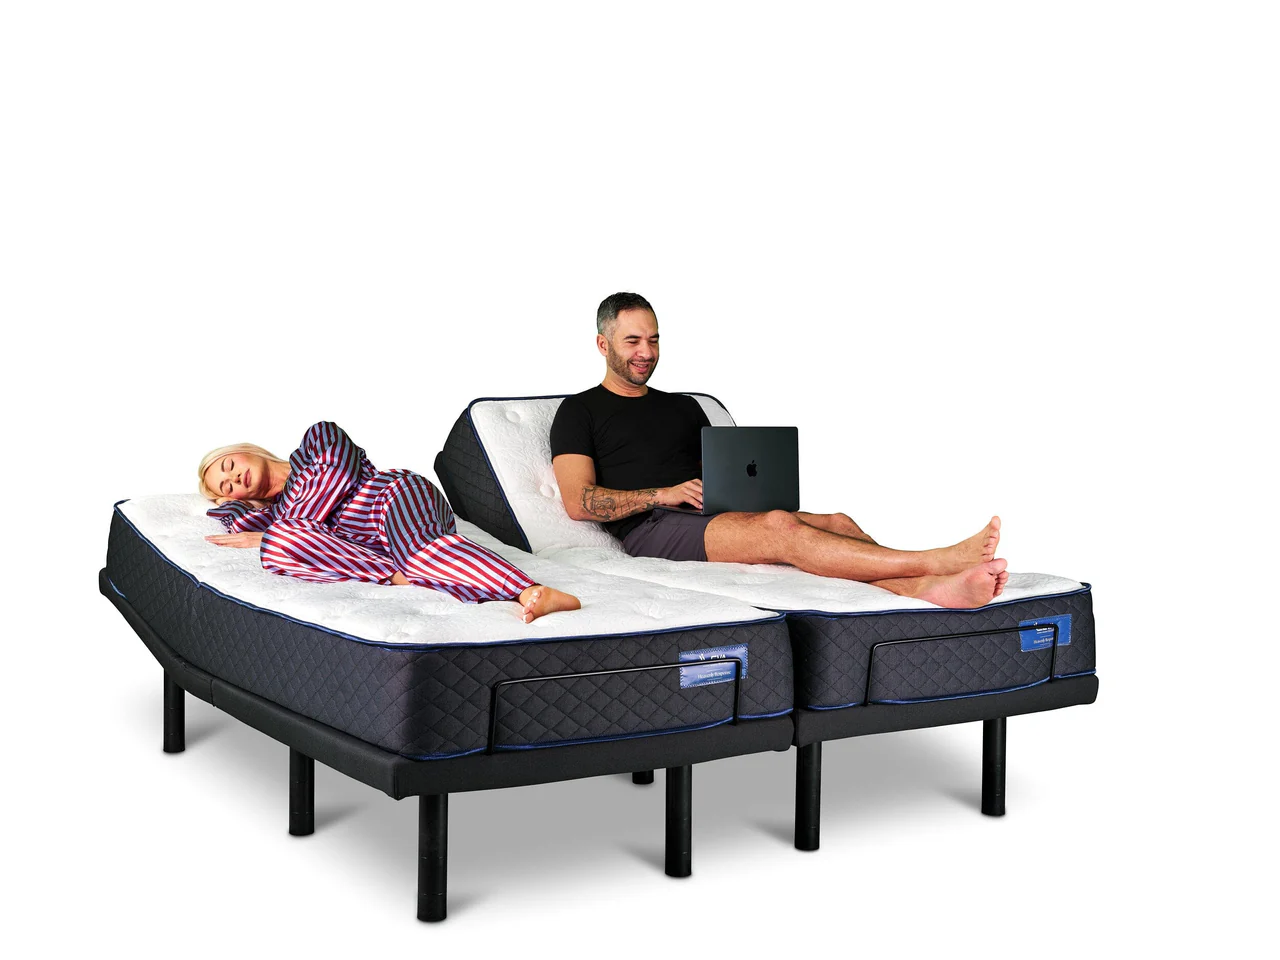
The result is a system where sleep data produces a physical outcome, a changed position, rather than just a number on a screen. That difference separates tracking sleep from improving it.
Frequently Asked Questions
Can a consumer sleep tracker accurately measure deep sleep?
Consumer sleep trackers estimate deep sleep (N3) from indirect signals, mainly movement and heart rate, rather than the delta brain-wave activity that defines N3 in clinical polysomnography. Published validation studies place deep-sleep stage accuracy substantially below sleep-versus-wake accuracy. The highest published four-stage agreement for any wrist device is a Cohen’s kappa of 0.53, a moderate level of agreement, and deep-sleep sensitivity varies widely across devices and study populations. In older adults, consumer devices have been shown to overestimate deep sleep by 70–97 minutes per night compared to PSG. Deep-sleep readouts from consumer trackers work best as directional trend data across multiple weeks rather than precise nightly measurements.
What is orthosomnia and how does it relate to sleep tracking?
Orthosomnia is a clinical term for anxiety or behavioral disruption caused by preoccupation with achieving optimal sleep tracker scores. It was first documented in a 2019 case series in the Journal of Clinical Sleep Medicine, which described patients who sought medical treatment for sleep complaints that originated in, or were substantially amplified by, their interpretation of consumer tracker data. The condition matters because consumer trackers report stage percentages with apparent precision that exceeds their actual measurement validity. A user who sees a low deep-sleep percentage and interprets it as a disorder may be responding to measurement noise, age-normal physiology, or device-specific overestimation rather than a genuine clinical finding. The American Academy of Sleep Medicine recommends that consumer tracker data supplement, not replace, clinical evaluation.
How much deep sleep is normal for adults over 50?
Deep sleep declines with age as a normal physiological process. As shown in the age-band table above, the Ohayon et al. meta-analysis found that adults aged 50–59 typically spend 5–9% of total sleep time in N3, declining to 1–5% for those over 70. This pattern reflects normal physiology that consumer trackers often flag incorrectly as abnormal. Pre-menopausal women tend to retain higher N3 percentages than age-matched men, and this advantage narrows during and after menopause.
Why do different sleep trackers give different results for the same night?
Consumer sleep trackers use different sensor combinations, proprietary algorithms, and training datasets, which produces divergent stage and duration estimates for the same sleep period. A wrist-worn device and a smart ring worn simultaneously will often report different total sleep times, REM percentages, and deep-sleep durations because they measure different peripheral signals and apply different classification models. Polysomnography itself has an expert inter-rater agreement of only 78.9–82.6% for epoch-by-epoch scoring, which sets a practical ceiling on how closely any peripheral device can match the clinical reference. Within-device trends, where you compare the same metric on the same device across multiple nights, are more reliable than cross-device comparisons or single-night absolute values. Switching devices resets the trend baseline and reduces the interpretive value of historical data.
What should couples look for in a sleep system that responds to tracking data?
Couples evaluating sleep systems that act on tracking data should confirm that the system closes the loop between detection and response automatically, without manual intervention. Key criteria include whether snoring or restless-sleep detection triggers a physical positional adjustment rather than only an alert, whether each partner’s side of the bed adjusts independently so one partner’s correction does not disturb the other, and whether the base is compatible with mattresses engineered to flex under articulation rather than resist it. For couples in rooms that cannot accommodate a Split King’s 76-inch footprint, a true Split Queen, which requires purpose-built 30" × 80" mattresses not available in the standard supply chain, preserves independent adjustability in a 60-inch width. Leva Sleep’s Split Queen adjustable bed collection and snoring relief systems are designed specifically for this use case. Transform your sleep with Leva Sleep by visiting the La Jolla showroom or shopping online today.


